Big Kahuna Trading Club-Market Rating System
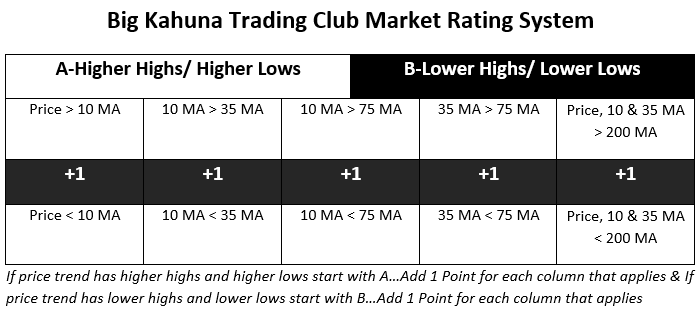
Over the course of a few decades trading the market, I developed a simple but effective way to keep me on the right side of the trend. I later turned it into a scoring system and here is how it works. I watch for how price interacts with the moving averages and its own prior trend. Stocks with higher highs and higher lows tend to continue upwards at least in the short-term. Stocks with lower highs and lower lows tend to continue down, again at least in the short-term.
Here is how I personally color my moving averages:
10-MA Red Line
35-MA Yellow Line
75-MA Cyan Line
150-MA Purple Line
200-MA Copper Line
I have used these same colored lines for years so that I don't have to think about it, I know at a glance where price is relative to which moving average.
There are some obvious caveats to the higher highs and higher lows theorem including a prime one: Has the price advance set a 'CH-3' suggesting that the price may be within 5-15 bars of a CH-4 reversal? This requires a little more of a complex explanation and if you want more details on that, the link to the TSS Cycle Trading Cheat Sheet above gets more indepth with it. The CH-3 trading rule on SPY here got you in at nearly the exact highs but the market rating system below performed better as far as 'meat of the move' eliminating nearly three months of 'chop' on the short. In the analysis of this market rating system, we'll assume that a price advance or decline already in motion will continue until the market rating shifts in the opposite direction.
So, as an example, let's look at this SPY weekly chart from 2021-2022. Throughout the price advance, price was printing higher highs and higher lows. That was until right about October 8, 2021. Although price didn't violate the prior lows, it did violate about 10 weeks of prior trading action. This was flashing a warning sign but our rules for a continued long were still in play. Throughout the uptrend the price was at an A-5 Rating. That was until the weekly bars violated the 10-MA in October knocking the score down to A-4 (price was now less than the 10-MA). The caution flags were up but no reason to exit the long just yet.
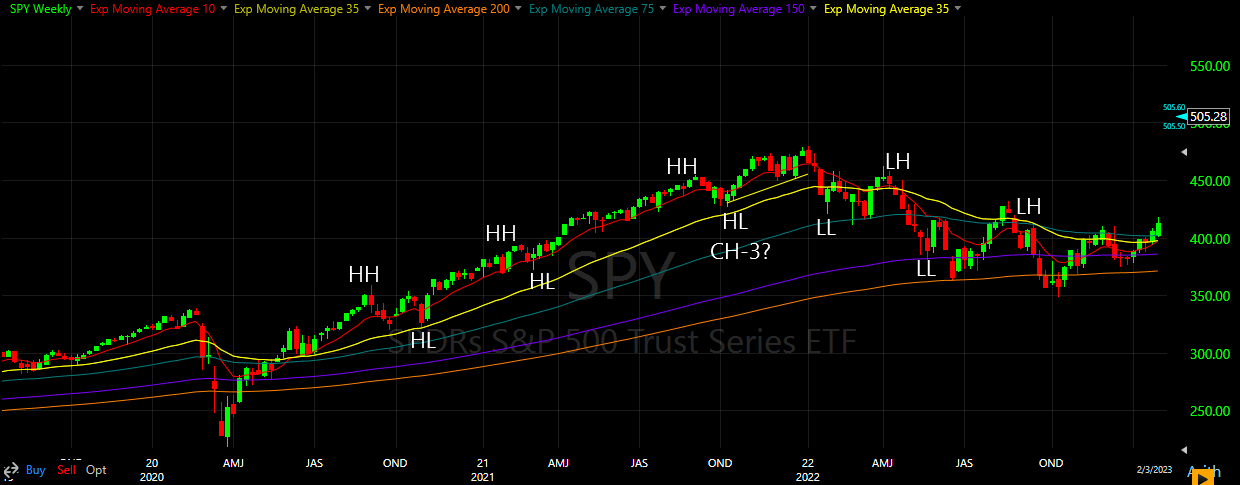
That was until January 28th when the price now had a lower low followed by a lower high a few months later on April 1st. Now here is where the market rating really shifted. Since we are now printing lower highs and lower lows the scoring now shifts over to 'B' (B-Lower Highs/ Lower Lows). Although the price briefly popped above the 10-MA, 2-weeks later the price moved back below the 10-MA and the 10-MA continued back down through the 35-MA. Then a few weeks later it moved down through the 75-MA. You can see based on the rules below the SPY index market rating went from its original A-5 down to a B rating then B1 (price less than 10-MA) B2 (10-MA less than 35-MA) then B3 (10-MA less than 75-MA).
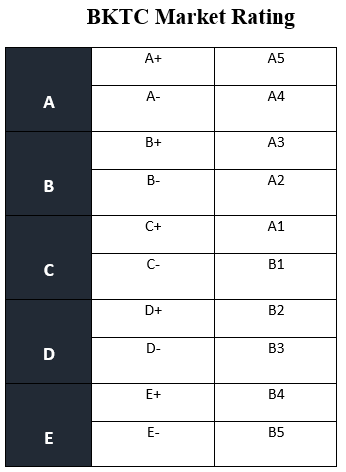
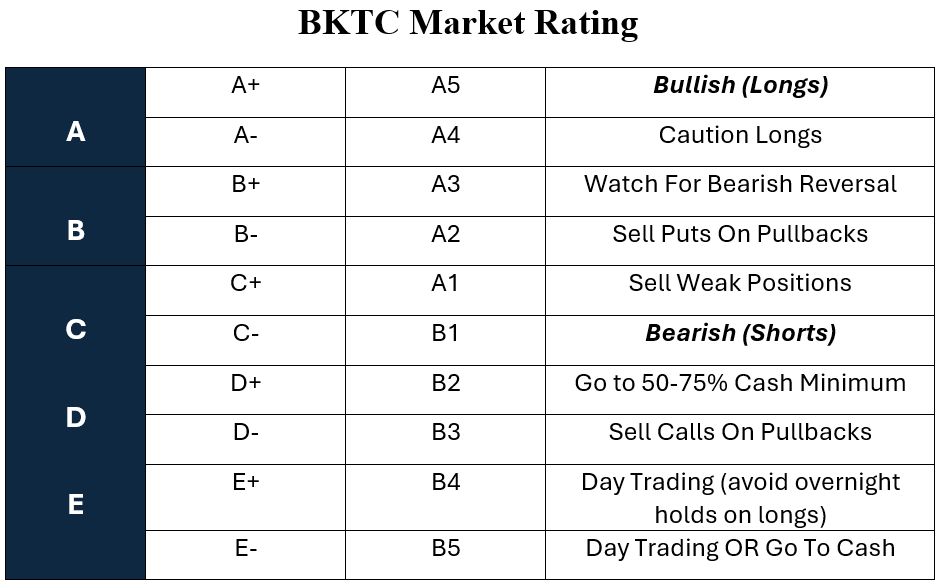
And here is part two of that. Once you have the rating from above apply it to this table. So when the SPY index weekly chart had the 10-MA move back down through the 35-MA on April 14th the rating would be at B-2. B-2 on the Market Rating Below is a D+ market. This is not a great place to be trading longs. In fact when the markets get really sketchy (moves into C range) it is a good idea (and one I do my best to follow) to be 75% in cash if not more.
If you are a skilled swing trader and instead of trading longs are looking for the best shorting opportunities then depending on your skill level you can be all in or partly in the market despite the bad market conditions. The advantage of the '75% Cash' rule is that if the market really whipsawed you and you lost 50% of the capital you were trading with, you would only be down 12.5% overall of your entire trading capital. Risk management is key if you want to stay in the game long-term. There is a time to surf and a time to sit on the beach in your beach chair and preserve capital for the next inevitable Up wave. Newbie traders tend to learn that AFTER burning their trading account up.
Follow these rules so that doesn't happen to you!
What Style Of Trading Is Best Suited For Which Market Rating?
The market and individual stock trends don’t always align 100%. In some down markets, particular stocks can buck the downtrend and continue marching northward. But that is the exception and not the rule and when we try to get ‘too cute’ by thinking that we can outguess the market that is when our account can get hammered…(ask me how I know 😉)
Here are some general rules that can help you to avoid market and account downdrafts:
Historical backtests show that when all indicators finally hit an extreme in one direction that is when it may reverse back in the other direction.
That is more likely the case for bearish trends reversing back to the bullish side.
Here is a breakdown of 30 years of trends on the DJ-30 index:
Percentage Calculations:
• Bullish Percentage:
(309 months / 360 months) × 100 = ~85.83%
• Bearish Percentage:
(51 months / 360 months) × 100 = ~14.17%
Follow the cycles (and market pulse by using this market rating system) to catch these prime turning points and get in and out before the crowd.
Keeping your powder dry for the next up-cycle can dramatically enhance your long-term longevity with trading!

Create Your Free Account